
Visualizing Nine Inch Nails
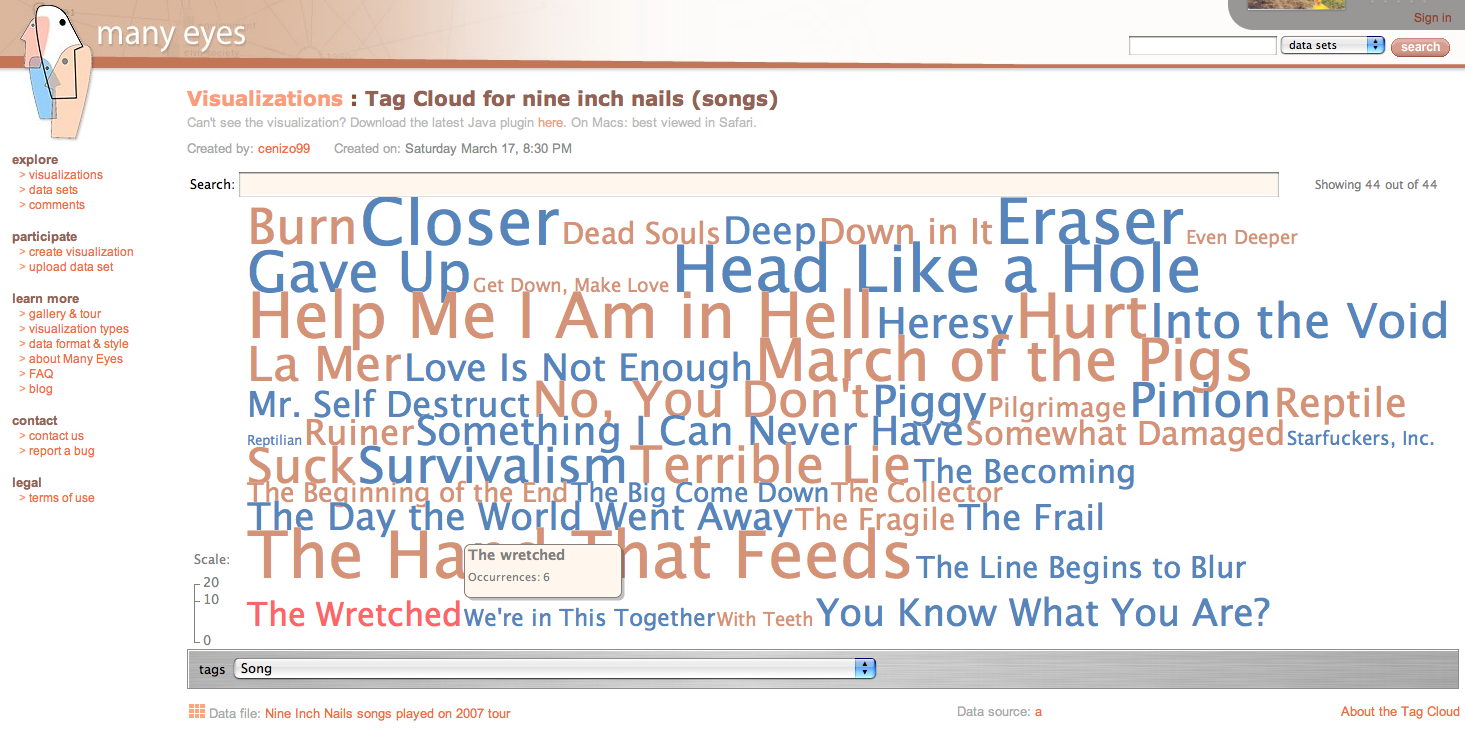
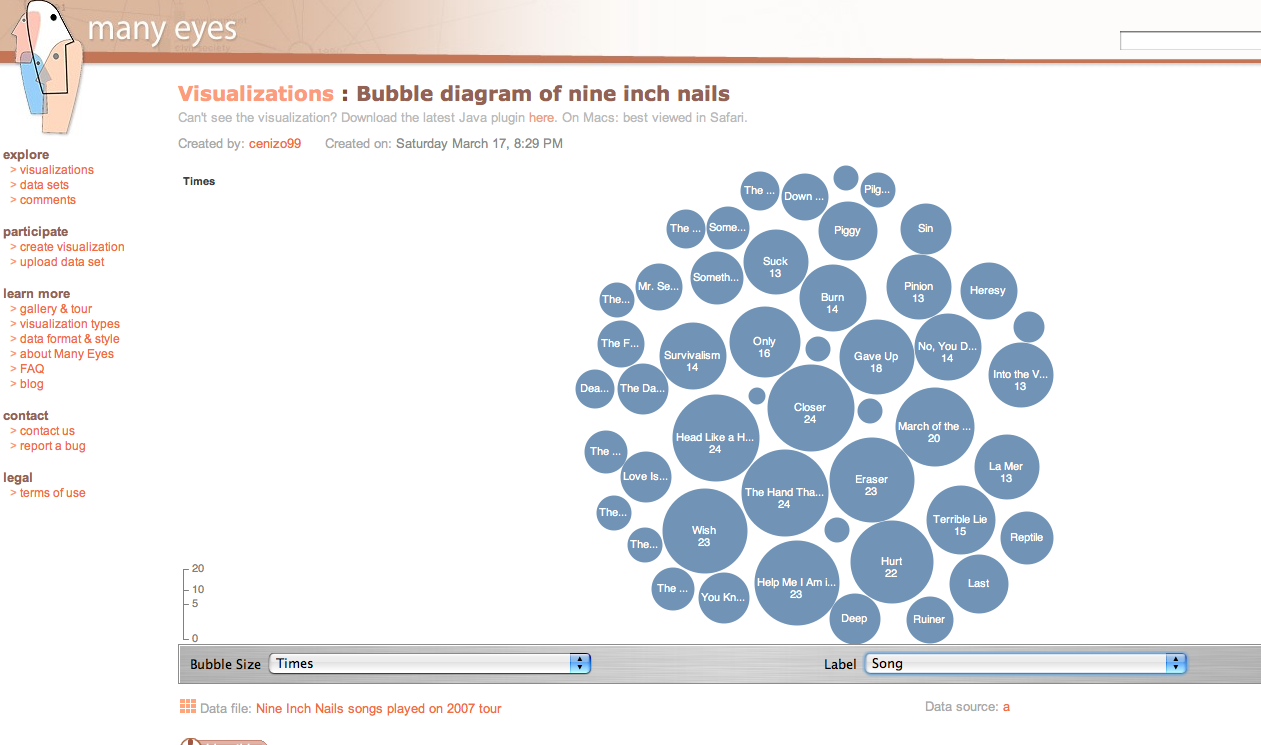
The other day I was encouraging fans to figure out ways to upload information to the social visualization site Many Eyes. Searching around on there today, I found a few compelling examples. Take, for instance, this tag cloud and bubble diagram of the songs Nine Inch Nails played on their 2007 tour (click the images to go to the database and see how interactive it really is — on Macs, it works best with Safari):
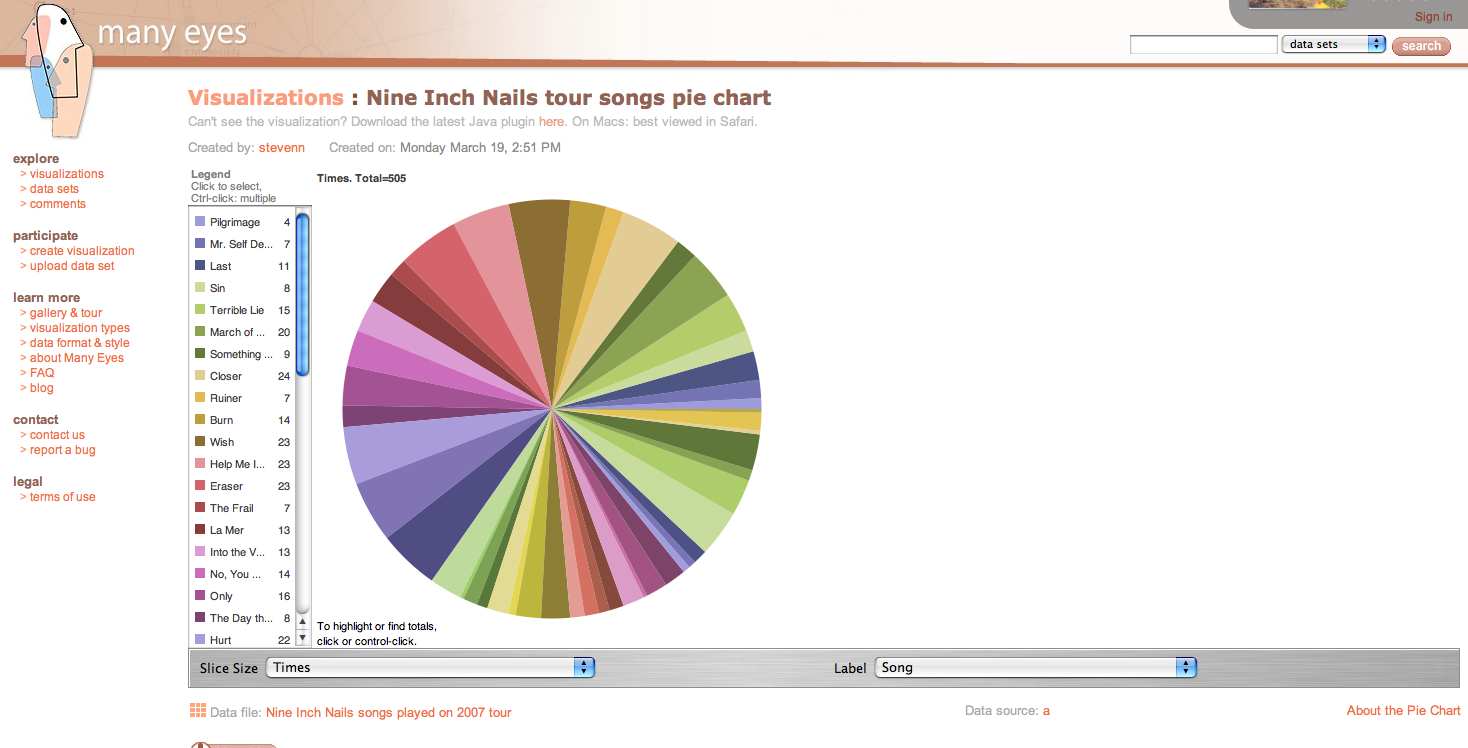
Or did you want that in pie chart form? (you can pull out the slices!)
So just think what you could do if it weren’t just one tour, but all the tours… Makes my fannish heart go pitter patter.
To get a real sense of the potential for instant insight, have a look at this tag cloud of more than 600 William Butler Yeats poems:

How those phrases leap! Hundred years! Years ago! Clock Tower! Long ago! Thousand years! Methinks I sense a motif … Paging Jane Austen fans!
There’s more fan stuff on there, including several very neat social network maps of tv shows and movies (and literature and the Bible, though I’m not sure the latter ought to be cast as fandom). But there ought to be a whole lot more, so start making those databases import-friendly now.