Looking at Music
Continuing with the visualizing fandom line I’ve been harping on recently: several Last.fm users have developed means of taking music-listening data from the site and generating all kinds of interesting things. Many are not visual — they are utilities to compare users’ listening overlaps and divergences, to assess how ‘mainstream’ or ‘extensive’ one’s musical taste is, and so on. See here for an extensive list.
Others demonstrate how visualization can provide really intriguing new ways to look at music. I am completely smitten with this oceanic visual representation of someone’s listening habits over time:

But I can’t make it work for myself as it requires Windows and some other things I don’t have.
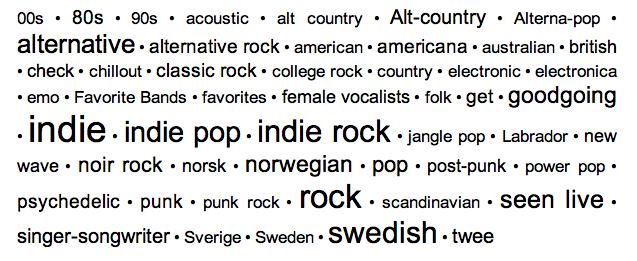
I can, however, take advantage of this tag cloud generator that looks at the top user-generated tags for your top artists. It pretty much nailed me (though I’m not sure what that “goodgoing” is all about):
Representations like these can also be generated for Last.fm groups to give an instant overview of communal taste and habits.
This is a truly new way of understanding and communicating music listening (and other elements of fandom) that the internet and, ack, web 2 APIs + user-generated content and applications make possible. Generating statistics and using them to make interesting and sometimes beautiful visual representations may not be for everyone, but I am guessing that online communities would do well to integrate utilities that let people generate visualizations of the data they accumulate, especially when they allow users to compare their own data to group data. Fandom is about identification and play, the more ways we have to represent ourselves through and play with our fandom, the more engaged we’re going to be.
And let’s hear it for the Last.fm fans who are creating these programs. If I ran Last.fm, I’d be trying to get some of these things incorporated into the site instead of leaving it all to clever fans to run on their own.


Slivka wrote:
Some really interesting stat-generators on the last.fm/group/Stats-page. I liked the one where you could make a desktop-wallpaper with albumcovers, http://lastfm.dave.cd/coverart.php5, lots of options too. Result is best if you listen to music with nice covers tho :)
Also liked the one you posted a screenshot from, with the blue oceanic cloud.
Posted on 07-May-07 at 3:00 am | Permalink
C26000 wrote:
I’m not sure how I got here, mmm I guess it was a comment in the last.fm blog, very interesting blog by the way, I browsed all 2007 articles and readed a couple of them. It’s always nice to see blog entries like this one about the things that you have made :) (like the one that Martin Dittus made in the official last.fm blog, that made the stats group get more than 200 new members in just 2 days :D)
About the wave graph , that someone’s listening habits are from my little brother :P (he is 13), he is so scared because the first thing that pops up when he search in google images pablomaya is his picture :D, now his listening habits are around the web as well :), I’ll show him tomorrow,he is currently sleeping …
and about the fact that you can’t have your own wave graph you just needed to ask, here is it :) :
http://img297.imageshack.us/my.php?image=popgurlwavegraphda3.png
(if you want a different color just tell me)
yours is one of the graphs that look amazingly good, because you have many stages where you listen a certain artist a lot, then leave it rest for a while, then find a new favorite and so on, I always enjoy looking a those kind of wave graphs :),
BTW
there is already an online tool for generating this wave graphs you can find it here:
http://www.last.fm/group/Stats/forum/46239/_/287977
Posted on 01-Jun-07 at 1:08 am | Permalink